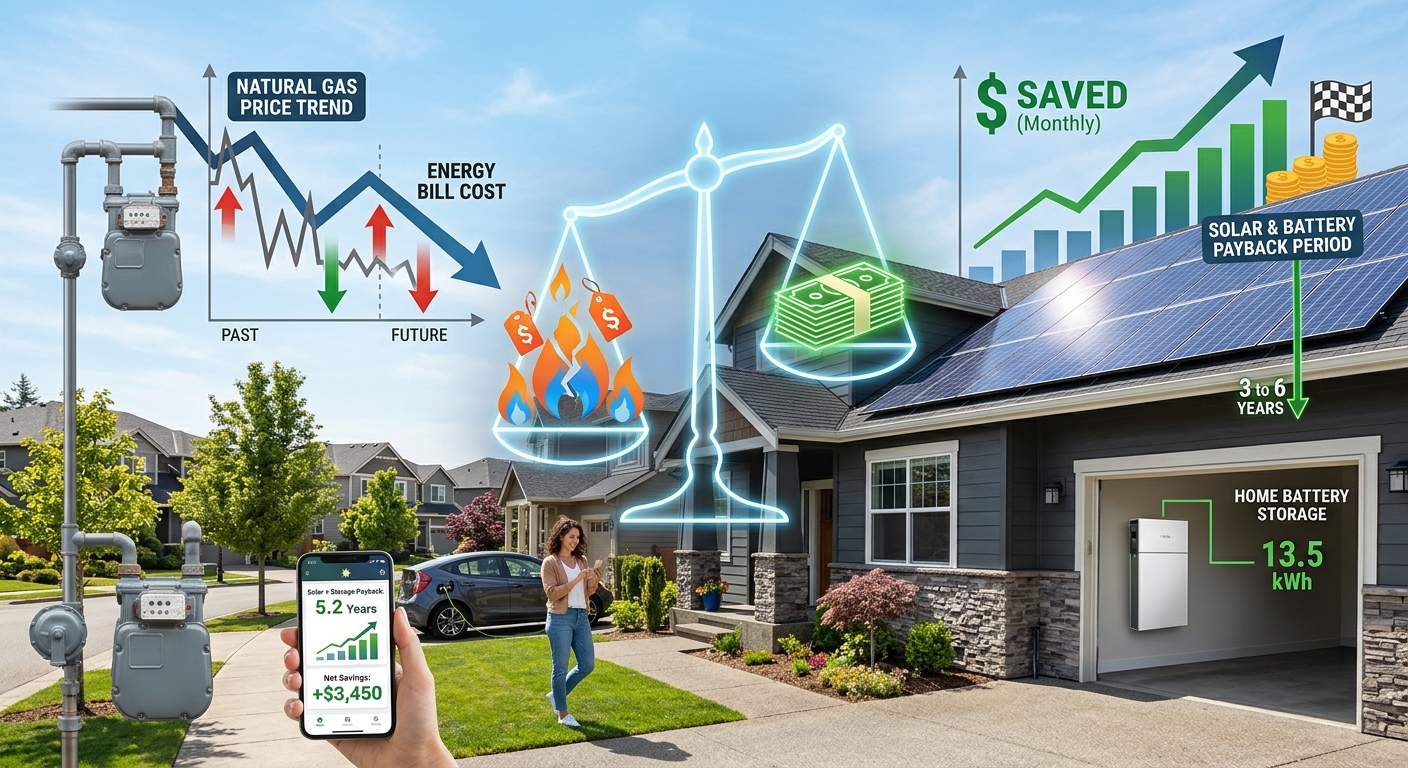
A solar quote can look attractive at today’s electricity rate and much less convincing under a cheaper tariff. Add a battery, and the decision gets more sensitive. The battery saves money by moving electricity into hours when it is worth more. Whether that benefit justifies its price depends on your utility’s rules, your household’s schedule, and the electricity you give up exporting.
Natural gas enters this calculation because it fuels electricity generation. Changes in fuel costs can influence utility rates, which then affect the value of rooftop generation and stored energy. But a gas market chart cannot tell you when your solar panels will pay for themselves. For that, you need a household budget and several realistic rate scenarios.
The Payback Test: In this example, solar alone recovers its $18,000 cost in about 13.8 years under a flat electricity rate of 25 cents per kWh. Adding a $10,000 battery shortens the combined system’s payback to 15.3 years only relative to less favorable battery scenarios, while extending it compared with solar alone. The battery’s own incremental payback is 19 years. Higher evening prices can improve that result. Generous export credits can erase the battery’s financial benefit.
Start With a Household Whose Numbers You Can Follow
Consider a household that uses 12,000 kilowatt-hours, or kWh, of electricity each year. Its proposed rooftop system produces 10,000 kWh annually. The installed solar price is $18,000. Adding a battery costs another $10,000, bringing the combined purchase to $28,000.
These are hypothetical cash prices used to make the comparison transparent. They are not national averages or current equipment quotes. No tax credit, rebate, financing charge, or incentive is included. If an incentive applies to your project, subtract its actual financial value from the relevant investment before calculating payback.
Without a battery, the household uses 4,000 kWh of solar electricity directly and exports 6,000 kWh. It still buys 8,000 kWh from the grid. Annual production is less than annual consumption, yet exports remain substantial because generation and demand occur at different times.
With a battery, direct solar consumption stays at 4,000 kWh. The battery takes in 3,000 kWh that would otherwise be exported and delivers 2,700 kWh to the house. That assumes 90% round-trip efficiency. The remaining 300 kWh represents storage losses.
Annual exports fall to 3,000 kWh, and grid purchases fall to 5,300 kWh. This assumes the battery has enough usable capacity and suitable daily charging opportunities to achieve that annual throughput. A household reserving much of its battery for outages may shift less energy.
Calculate Savings Before Dividing by the Installation Price
Simple payback equals upfront cost divided by annual bill savings. It is a useful starting point, but it does not measure the full investment return. For these first calculations, production, consumption, and tariffs remain constant. Maintenance costs, equipment replacements, and the time value of money are excluded.
Value electricity used directly. Multiply solar electricity consumed at home by the variable retail charges it actually avoids.
Value exported electricity. Multiply exported kWh by the applicable export credit, allowing for timing and settlement rules.
Calculate the battery’s added savings. Value discharged electricity at the avoided purchase rate, then subtract credits lost when solar electricity goes into storage.
Compare both investment decisions. Calculate payback for solar alone and the combined system, then calculate whether the battery’s additional cost earns enough additional savings.
Fixed customer charges remain payable in this example. They are excluded from savings. Dividing your entire electricity bill by consumption can overstate the value of solar if that average includes charges your installation cannot avoid.
A Middle-Rate Scenario Gives Solar the Stronger Financial Case
Begin with a flat import rate of $0.25 per kWh and an export credit of $0.05 per kWh. Without either installation, annual variable electricity charges would be $3,000: 12,000 kWh multiplied by $0.25.
Solar alone avoids $1,000 of purchases through direct consumption. Its 6,000 kWh of exports earn another $300. Total annual savings equal $1,300, leaving $1,700 in net variable charges. Dividing $18,000 by $1,300 gives a simple payback of 13.8 years.
The combined system avoids $1,675 of purchases: 6,700 kWh of direct and stored solar electricity multiplied by $0.25. Its remaining exports earn $150. Annual savings reach $1,825, and net variable charges fall to $1,175. The $28,000 investment has a simple payback of 15.3 years.
The battery therefore adds $525 in annual savings. Its separate payback is $10,000 divided by $525, or 19.0 years. That is the number to examine when deciding whether to add storage to an already attractive solar proposal.
How Gas Costs Can Reach Your Electricity Bill
Tracking the natural gas price can help you understand one source of pressure on electricity generation costs. A gas-fired generator buys fuel to produce electricity. When its fuel becomes more expensive, its production costs can rise. Where gas-fired plants help set wholesale electricity prices, that pressure can affect the wider power market.
Wholesale gas prices do not translate directly into household bills. Utilities may buy fuel under contracts, hedge their exposure, or purchase electricity from several sources. Retail rates also recover transmission, distribution, customer service, and other approved costs. Regulatory reviews and fuel adjustment mechanisms can change when costs reach customers.
A 30% rise in a gas benchmark therefore does not imply a 30% rise in your electricity tariff. Your export credit may also follow different rules from your import price. Treat fuel prices as a reason to test several electricity-rate outcomes, rather than as a formula for predicting your bill.
Lower and Higher Retail Rates Change the Recovery Period
Keep the household’s equipment and energy flows unchanged. Keep the export credit at $0.05 per kWh. Change only the flat retail import rate.
Lower Import Prices Stretch Both Payback Periods
At $0.16 per kWh, solar alone saves $640 through direct consumption and earns $300 from exports. Its $940 annual benefit produces a 19.1-year payback.
Solar plus storage saves $1,072 through avoided purchases and earns $150 from exports. Total savings are $1,222, giving the combined investment a 22.9-year payback. The battery adds only $282 annually, implying a separate payback of 35.5 years.
That battery result is a warning about the economics of energy shifting under this tariff. A calculated recovery period extending far into the future needs careful comparison with equipment life and replacement costs.
Higher Import Prices Increase the Value of Stored Electricity
At $0.35 per kWh, solar alone saves $1,700 annually and pays back in 10.6 years. The combined system saves $2,495 annually and pays back in 11.2 years.
The battery contributes $795 in additional annual savings. Its incremental payback falls to 12.6 years. Storage has become more financially appealing, although solar alone still recovers its initial cost sooner.
These are constant-rate scenarios, not forecasts. A rate increase arriving several years after installation produces a different cash-flow result from a higher rate applying immediately.
Export Credits Can Matter More Than the Gas Market
Now assume a flat $0.25 import rate and full retail export compensation of $0.25 per kWh. For this simplified case, every exported kWh receives usable financial value. Actual settlement rules, credit expiration, and unavoidable charges can change the outcome.
Solar alone produces $2,500 in annual value: $1,000 from direct consumption and $1,500 from exports. Its payback is 7.2 years.
With storage, avoided purchases are worth $1,675 and exports earn $750. Total annual value falls to $2,425. The battery reduces annual savings by $75 because its losses consume electricity that could have received the same retail value through export.
The combined system’s simple payback is about 11.5 years, but the battery has no positive incremental bill-savings payback under these assumptions. Paying for storage may still make sense for backup power. It requires a separate justification from electricity savings.
Expensive Evening Hours Can Strengthen the Battery Case
A time-of-use tariff changes the calculation again. Assume directly consumed solar avoids purchases at $0.22 per kWh. Battery discharge avoids evening purchases at $0.45 per kWh. Export credits remain $0.05 per kWh.
Solar alone creates $880 in direct savings and $300 in export credits, totaling $1,180 annually. Its simple payback is 15.3 years.
The battery’s 2,700 kWh of discharge avoids $1,215 in evening purchases. Charging it sacrifices $150 in export credits. Its additional annual benefit is therefore $1,065, producing an incremental payback of 9.4 years.
The combined system saves $2,245 annually and pays back in 12.5 years. Here, adding storage improves the combined payback compared with solar alone.
This result depends on delivering all modeled battery output during expensive hours. If evening household demand is too low, some discharge earns less. Seasonal tariff changes, backup reserves, and cloudy periods can also reduce the benefit. Hourly consumption data provides a firmer estimate than annual totals.
The Assumptions That Deserve Your Closest Attention
Installed price changes payback immediately. At the middle-rate battery benefit of $525 annually, a $7,000 battery addition pays back in 13.3 years. A $13,000 addition takes 24.8 years. Check whether quotes include electrical work, backup controls, permitting, and installation labor.
Equipment aging changes future savings. The examples hold solar output and battery throughput constant. A fuller model should account for declining output, changing usable storage capacity, and any replacement needed during the analysis period. Warranty length and warranted energy throughput help frame that assessment.
Financing changes household cash flow. A $28,000 purchase financed over 15 years at an illustrative 8% annual interest rate requires roughly $268 per month, before fees. The middle-rate example saves about $152 per month on average. The project would increase monthly outgoings during repayment under those assumptions.
Backup has a separate personal value. Keeping refrigeration, communications, or medical equipment running may justify spending that bill savings alone cannot support. Confirm what the proposed system can power during an outage. Then decide how much that service is worth to your household.
Simple payback leaves out investment timing. For a final decision, compare discounted lifetime cash flows with and without storage. Include maintenance, financing, replacements, and the return you could earn elsewhere. A system can repay its purchase price eventually while still falling short of your financial target.
Let Your Tariff Set the Purchase Decision
Natural gas prices can influence the electricity market, but your utility tariff determines how much rooftop generation and stored energy save you. In this household example, solar performs best when avoided purchases or export credits carry substantial value. Storage earns its strongest financial case when it replaces expensive evening electricity while giving up relatively little export income.
Before signing, request calculations using your actual consumption pattern, approved tariff, export rules, and complete installed price. Ask for lower, middle, and higher rate scenarios. Judge the battery by its additional savings and its backup value. That gives you a purchase decision grounded in your household’s needs, with room for energy prices to move.